
Open any expense tracker and what do you see? A list of transactions. Maybe a chart of this month's spending. That's useful, but it's a snapshot — a single frame from a much longer movie. Who were you financially six months ago? How has your discipline changed? Are you getting better, or drifting?
My Stats answers those questions. It's not a gamified dashboard. It's a time machine for your financial life. Every chart, every counter, every calendar cell is a data point on a timeline that tells your unique story.
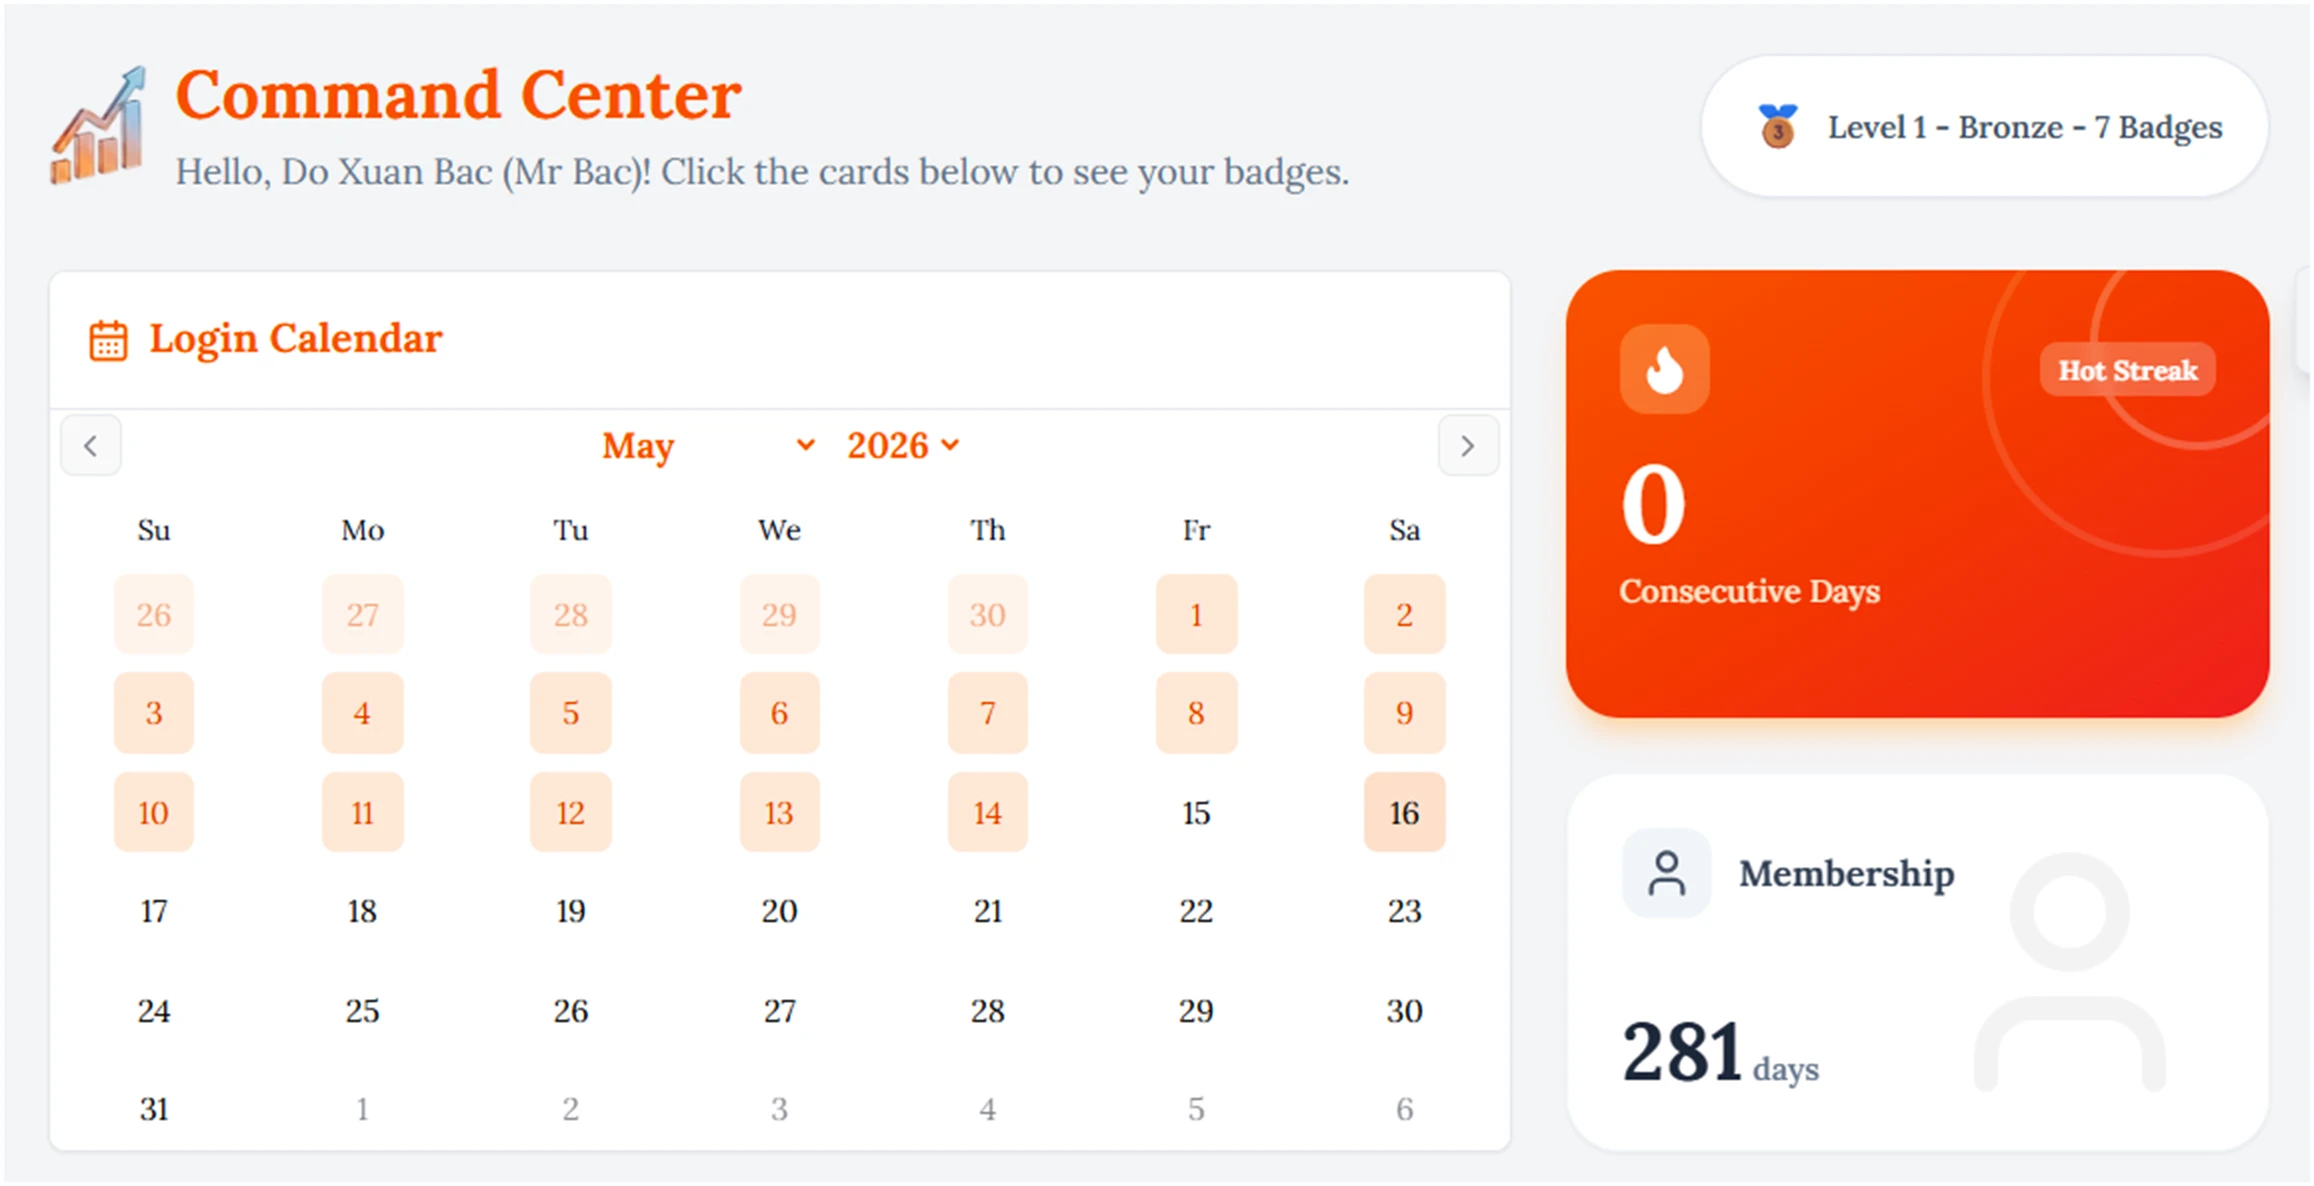
Your Login Calendar: The Rhythm of Consistency
At the heart of My Stats is a visual login calendar. Every day you open the app gets a green mark. Every day you skip stays gray. Over weeks and months, patterns emerge. You'll see the weeks you were dialed in — and the weeks life got in the way.
This isn't about 'streaks' as a game mechanic. It's about understanding your own rhythm. When are you most consistent? What breaks your flow? The calendar answers these questions not with notifications or nudges, but with quiet, undeniable data. Self-awareness, not gamification, drives lasting change.
Your Stats, Built From Real Actions
Every data point in My Stats is earned. When you log an expense, it's recorded. When you pay off a debt, the system notes it. When you complete a goal, that milestone is timestamped and stored. Over time, these individual actions accumulate into a comprehensive statistical profile.
The page shows you how many expenses you've logged in total, how many debts you've closed, how many goals you've achieved, and how many subscriptions you're actively managing. These aren't abstract badges. They're real numbers that reflect your actual engagement with your money — and they only go up when you do real work.

Progress That Compounds Visibly
There's something deeply satisfying about watching your numbers climb. Your first month might show 12 expenses logged and 0 goals completed. By month three, it's 150 expenses and 2 goals. By month six, you're looking at 500+ transactions and a growing list of financial wins.
This visible trajectory is powerful because it's irrefutable. You can't argue with a calendar that shows you tracked every day for 90 days straight. You can't dispute a counter that says you've logged 1200 expenses and paid off 4 debts. The data becomes your financial biography — honest, unvarnished, and motivating in a way no app notification ever could be.
Rank Levels: From Novice to Diamond
As you collect badges across different categories, your overall rank grows. Each rank represents a milestone in your financial journey — from a curious beginner to a disciplined master.
Level 0
Novice 🌱
Level 1
Bronze 🥉
Level 2
Silver 🥈
Level 3
Gold 🥇
Level 4
Diamond 💎
Badge Gallery: Every Milestone Unlocked
Each category has four tiers of achievement. Here's the complete collection of what you can unlock as you engage with your finances.
Expenses Logged
Manager
Apprentice
10 expenses
Manager
Adept
50 expenses
Manager
Expert
100 expenses
Manager
Master
500 expenses
Debts Paid
Trustworthy
Responsible
1 debt paid
Trustworthy
Reliable
5 debts paid
Trustworthy
Freedom
15 debts paid
Trustworthy
Prosperity
30 debts paid
Lendings Recovered
Creditor
Initiate
1 lending recovered
Creditor
Enthusiast
5 lendings recovered
Creditor
Investor
15 lendings recovered
Creditor
Shark
30 lendings recovered
Notes Created
Secretary
Observer
10 notes
Secretary
Chronicler
50 notes
Secretary
Journalist
100 notes
Secretary
Historian
250 notes
Goals Completed
Champion
First Step
1 goal completed
Champion
Determined
10 goals completed
Champion
Disciplined
20 goals completed
Champion
Legendary
50 goals completed
Long-Term Engagement That Sticks
The dirty secret of personal finance apps is that most users quit within 30 days. Not because the app is bad, but because the feedback loop is weak. You log an expense, nothing visible changes. You check a budget, the number adjusts. That's it.
My Stats changes the feedback loop by giving you something to build. Every login becomes a contribution to a growing body of personal data. Every action adds to a timeline you can look back on with pride. We've seen users with 60-day, 90-day, and even 200+ day engagement streaks because My Stats makes the invisible progress of financial discipline actually visible.
Your financial history is your most valuable asset.
My Stats doesn't give you points. It gives you perspective. See exactly where you started, how far you've come, and where you're headed — all backed by your own real data.
From Snapshot to Story
Version 2.35.0 introduced My Stats, and it's become the page our most engaged users return to most often. Not because it's flashy, but because it's honest. It shows you exactly what you've been doing — good, bad, and inconsistent — and lets the data speak for itself.
There are no imaginary points. No artificial levels. No gamification gimmicks. Just your actions, tracked over time, presented in a way that makes you want to come back tomorrow and add one more green dot to your calendar. Because that's what real motivation looks like — not a badge you unlock once, but a story you're still writing.